数学英雄
帮助🇲🇾中学生所提供的
Math & Add. Math 参考资料
(教程内容是依据马来西亚KSSM的课程)
Chapter 12: Data Handling
假设,你在学校采访了100位学生。以下哪个从学生所得到的资料是不会有可变性或多样性的答案?
Suppose you interviewed 100 students at your school. Which of the following information collected from students will NOT give variability or diversity in answers?
A. Height
B. Name of school
C. Gender
D. Favourite genre of music
既然,是在学校进行访问的,所以答案是B,因为全部你采访的学生都会给同一个校名。
而那些得到多个或不同答案的问题,我们称之为 Statistical questions,就是可以用来统计。
假如,我们想知道男女学生所提供的资料是否存在差异,收集(Collect)资料(information) 后,下一步就是整理(Organise)数据 (data)。这步骤包括对数据进行分类(Classify),然后用适当的图来表示(Represent)数据,这样就可以更容易地解释(Interpret)数据。
Example Questions:
Figure 1, 2, 3, & 4 represent the data collected from the 100 students during the interview at school. Answer the following questions based on the respective (相应) figure.
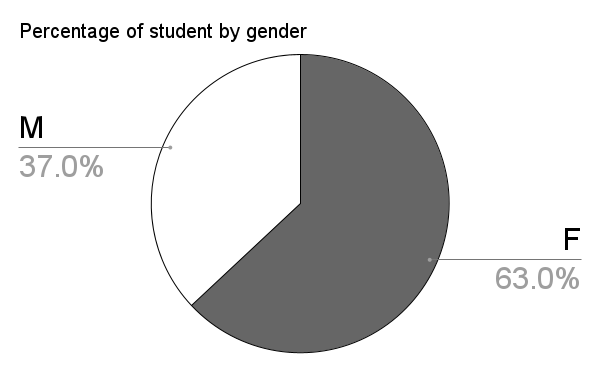 (Figure 1)
- Based on the pie chart in Figure 1, how many students are male?
$$\begin{aligned} &Total\ no.\ of\ students \times \frac{percentage\ of\ male\ students}{100 %} \\ &= 100 \times \frac{37}{100} \\ &= 37 \end{aligned}$$
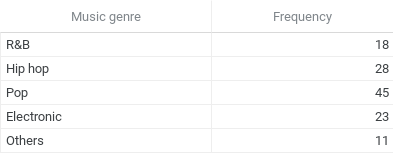
The frequency table below shows the music genres enjoyed by students who participated in the interview.
 (Figure 2)
- Which genre of music is the least popular?
A. R&B
B. Jazz
C. Pop
D. Not available - Is electronic music more popular among male or female students?
A. Male
B. Female
C. Not available - Is it possible that a student reported having enjoyed more than 1 genre of music?
A. Yes
B. No
C. Not available
Answers
题目问的是“least(最少)popular“ 就是最不受欢迎的音乐风格。Frequency table 里的frequency(次数)最少的music genre 是 ”Others“,代表“其它的”。也就是说,几种不同的音乐风grouped在一起。因此,我们无法知道哪个音乐风格被提的次数最少,所以答案是D。
Frequency table 并没有将数据分为男性或女性学生,所以答案是C。
有没有学生表示喜欢不止一种音乐风格?如果,你把 Frequency 的那些数字加➕起来,total 会是125。说明100位学生里,有些学生表示喜欢多过1个曲风,所以答案是A。
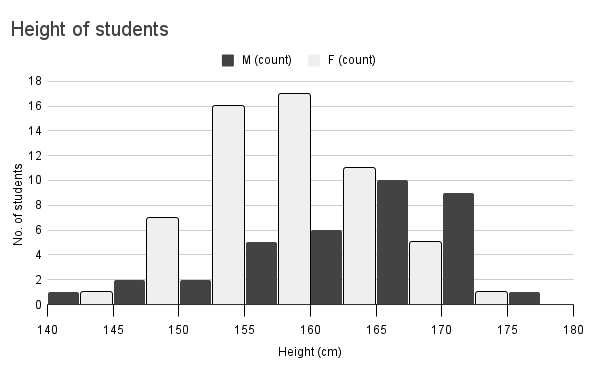
Figure 3 is a histogram of the height reported by the same 100 students interviewed.
 (Figure 3)
- How many male students reported having a height of 167cm?
A. 10
B. 5
C. 2
D. Not available - How many of the female respondents are taller than 160cm?
A. 11
B. 17
C. 34
D. 24 - Which of the following height group do majority of male and female students fall into?
A. M: 175 ~ 180cm ; F: 170 ~ 175cm
B. M: 165 ~ 170cm ; F: 160 ~ 165cm
C. M: 165 ~ 170cm ; F: 155 ~ 160cm
D. M: 160 ~ 165cm ; F: 155 ~ 165cm
Answers
- Figure 3 里的 x-axis 是不是找不到 167cm?而且,height 的 data 是已经组合起来的,例如:165~170cm,这种 data 我们称它为 continuous data 连续数据, 就是只要 data 是在那个范围里,就把它们grouped起来。因此,我们不能够明确地知道多少男生的高度是167cm,所以答案是D。
相反的如果 data 是一个很分明的数字,比如:18 / 11 / 10.5,我们把它称为 discrete data。
- 把 160~165cm, 165~170cm, 170~175cm, 175~180cm 的 F 加起来。答案是B
- majority 的意思是 大多数/大部分…… 照图来看,男生身高大多数是 165~170cm,而大部分女生的身高是 155~160cm。所以,答案是C
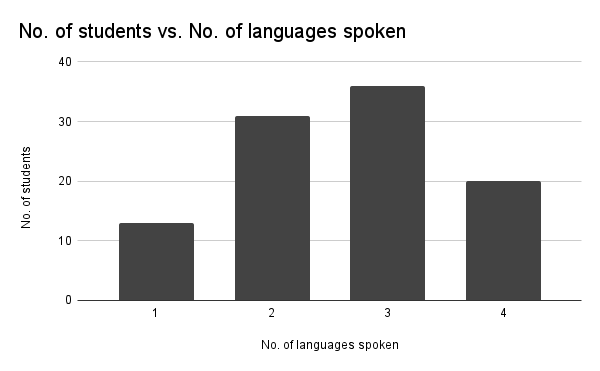
Figure 4 shows a bar chart of the number of languages spoken by students.
 (Figure 4)
- Over 65% of the students reported speaking 2 ~ 3 languages. How many students belong to the minority group of speaking just 1 language?
A. 20
B. 13
C. 15
D. 10
over 65% 就是超过65位的学生会讲2个或3个语言。还有,20位学生是会讲4种语言。
100 - 20 = 80
只要是 > 65 :
80 - 66 = 14
所以,可以少过 14 的,是B。D,是不可能的,因为照图里看,1 的 bar 是超越了 10 位学生的。
- Can you tell what is the difference between the data in Figure 1 or 2, and the data in Figure 3 or 4?
你能看出图 1 或 2 中的数据与图 3 或 4 中的数据有什么区别吗?
就是图 1 或 2 的数据不是数字的,而图 3 或 4 的数据是数值。
非数值数据,我们称为 Categorical data 类别数据。
数值 或 数字型数据,我们称为 Numerical data。
你可能会觉得,Figure 2 的 frequency table 里有frequency的数字啊,那怎么会是类别行的data?那个frequency 是把music genre的 data 在整理数据时把出现的次数总结出来的。所以,学生所提供的是 categorical data(R&B,Pop,Hip Hop 等等)。